This online Empirical Rule Calculator finds the ranges of 1 standard deviation, 2 standard deviations, and 3 standard deviations from the mean, which contain 68%, 95%, and 99.7% of normally distributed data, respectively.
What is the Empirical Rule
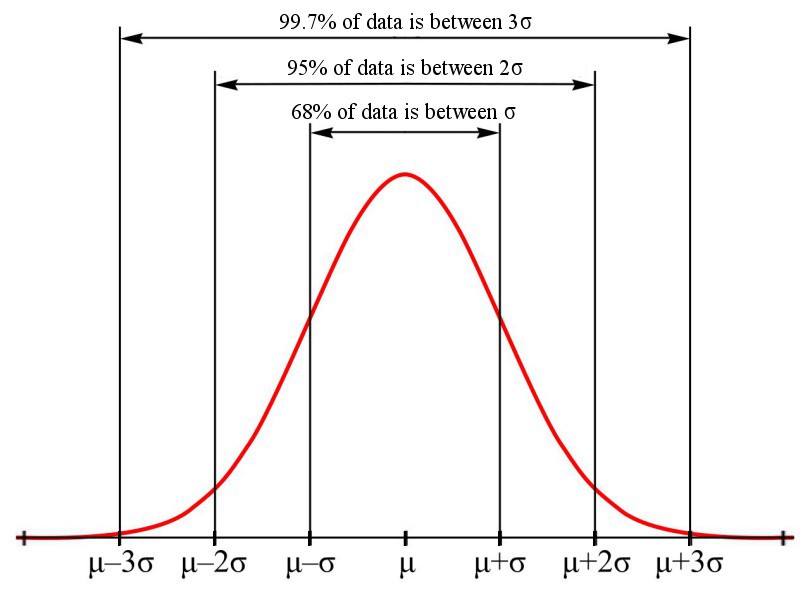
The empirical rule, also referred to as the three-sigma rule or 68-95-99.7 rule, is a statistical rule which states that for a normal distribution, almost all observed data will fall within three standard deviations (denoted by σ) of the mean or average (denoted by µ).
In particular, the empirical rule predicts that 68% of all observations falls within the first standard deviation (µ ± σ), 95% falls within the first two standard deviations (µ ± 2σ), and 99.7% falls within the first three standard deviations (µ ± 3σ).
Recall that the mean is the sum of the values in the data set divided by the total number of values. Standard deviation is a measure of the scatter of the data, it determines how much the data values can differ from the mean.
The empirical rule is often used in statistics to predict final outcomes. Knowing the value of the standard deviation, this rule can be used as a rough estimate of the results of accurate data collection.
The empirical rule is also used as a rough but simple way to check if a distribution is normal. For example, if too many data points fall outside of the three standard deviation limits, it indicates that the distribution is not normal and may correspond to some other function.
The empirical rule is beneficial because it serves as a means of predicting data. This applies to cases of large data sets. For example, in finance, this rule applies to stock prices, price indices, etc.
Example of the Empirical Rule
The average age of retirement for the entire population in a country is 65 years. The distribution of retirement age is normal with a standard deviation of 5 years. What is the probability that a person will retire after age 70?
To solve the problem we can use our Empirical Rule Calculator. Let’s plug into the calculator the values of mean (65) and standard deviation (5).
We see that age 70 differs from the mean by one standard deviation. This means that 68% of the population retires between the ages of 60 and 70. Accordingly, 32% of the population retires before the age of 60 or after the age of 70.
Given that the normal distribution is symmetrical about the mean, it is easy to see that only 16% of the population retires over the age of 70.
Related calculators
Check out our other statistics calculators such as Chebyshev’s Theorem Calculator and P-value Calculator.