Quadratic regression is the process of finding the quadratic function that best fits a given data set. We consider a function y = a + bx + cx2, where parameters a, b and c are to be found in such a way that this function is the best approximation of the data. Enter the set of x and y coordinates of the input points in the appropriate fields of the Quadratic Regression Calculator and calculate the regression function parameters. You can paste the data copied from a spreadsheet or csv-file or enter manually using comma, space or ‘enter’ as separators.
Quadratic Regression Equation
The quadratic regression is a form of nonlinear regression analysis, in which observational data are modeled by a quadratic function. In particular, we consider the following quadratic model:
$$y=a+bx+c{ x }^{ 2 }.$$
Now we can apply the method of least squares which is a mathematical procedure for finding the best-fitting line to a given set of points by minimizing the sum of the squares of the offsets of the points from the approximating line.
The condition for the sum of the squares of the offsets to be a minimum is that the derivatives of this sum with respect to the approximating line parameters are to be zero. These lead to the following set of three linear equations with three variables:
$$a\sum _{ i=1 }^{ n }{ { x }_{ i }^{ 2 }+b } \sum _{ i=1 }^{ n }{ { x }_{ i }+cn=\sum _{ i=1 }^{ n }{ { y }_{ i }, \quad \quad \quad } }$$
$$a\sum _{ i=1 }^{ n }{ { x }_{ i }^{ 3 }+b } \sum _{ i=1 }^{ n }{ { x }_{ i }^{ 2 }+c\sum _{ i=1 }^{ n }{ { x }_{ i } } =\sum _{ i=1 }^{ n }{ { { x }_{ i }y }_{ i } } }, $$
$$a\sum _{ i=1 }^{ n }{ { x }_{ i }^{ 4 }+b } \sum _{ i=1 }^{ n }{ { x }_{ i }^{ 3 }+c\sum _{ i=1 }^{ n }{ { { x }_{ i }^{ 2 } } } =\sum _{ i=1 }^{ n }{ { { x }_{ i }^{ 2 }y }_{ i } } } .$$
The solution to this system gives us the parameters \(a\), \(b\) and \(c\).
Our quadratic regression calculator also calculates the correlation coefficient of the input data. The correlation coefficient measures the strength of quadratic relationship between two variables and thus gives the quality of a least squares fitting to the original data.
The correlation coefficient \(r\) (sometimes also denoted \(R\)) is defined by the formula:
$${ r }^{ 2 }=1-\frac { \sum _{ i=1 }^{ n }{ { ({ y }_{ i }-a-b{ x }_{ i }-c{ x }_{ i }^{ 2 }) }^{ 2 } } }{ \sum _{ i=1 }^{ n }{ { ({ y }_{ i }-\bar { y } ) }^{ 2 } } } ,$$
where \(\bar { y } =\frac { 1 }{ n } \sum _{ i=1 }^{ n }{ { y }_{ i } } \).
The correlation coefficient has the following characteristics:
1. The range of \(r\) is between -1 and 1, inclusive.
2. If 0.7 < |\(r\)| ≤ 1 the data points are in strong correlation.
3. If 0.4 < |\(r\)| ≤ 0.7 the data points are in moderate correlation.
4. If 0.2 < |\(r\)| ≤ 0.4 the data points are in weak correlation.
5. If 0 ≤ |\(r\)| ≤ 0.2 the data points are in no correlation.
Quadratic Regression Model
Let’s look at an example of using quadratic regression to select the model that best describes the data. The table below shows the number of movie tickets sold in the U.S. and Canada from 1980 to 2018.
If we now plug this data into our Quadratic Regression Calculator we can get the following results: \(y=-2579.724+2.575·x+0.001·{ x }^{ 2 }\) and \(R = 0.814.\)
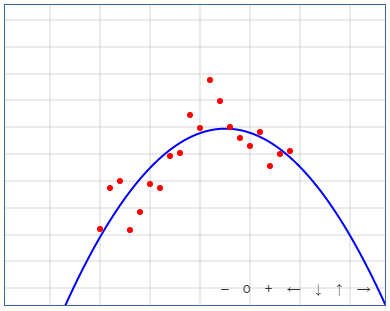
As you can see from the above graph, the approximating curve is in good agreement with the scatter of points from the data table. The value of the correlation coefficient \(R = 0.814\) also indicates that the data points are in strong correlation.
If we now plug the initial data into our Linear Regression Calculator and Exponential Regression Calculator we well get respectively \(R = 0.623\) and \(R = 0.643\). These are significantly lower results that indicate only a moderate correlation which can also be seen from the respective graphs. So the better-fitting model in this case is the quadratic model.
Example of Quadratic Regression
Recently there has been a lot of research on the efficient use of road transport in urban areas. The goal is to determine the optimal speed for maximum fuel economy and, as a result, reducing harmful emissions into the atmosphere.
Studies show that fuel consumption tends to be higher at both low and high average urban speeds. At low speeds fuel consumption may be higher due to increased idle time and frequent acceleration and deceleration. At high speeds fuel consumption may be higher due to increased aerodynamic drag and tire rolling resistance.
By driving at moderate speeds and using techniques such as smooth acceleration and deceleration it is possible to reduce fuel consumption and save money on fuel costs. This raises the question of the optimal speed minimizing fuel consumption.
Here is an example table showing the approximate average fuel consumption of a typical vehicle at different average speeds in urban traffic:
Plugging this data into our calculator we can get the following results: \(y=13.778-0.253·x+0.002·{ x }^{ 2 }\) and \(R = 0.997.\)
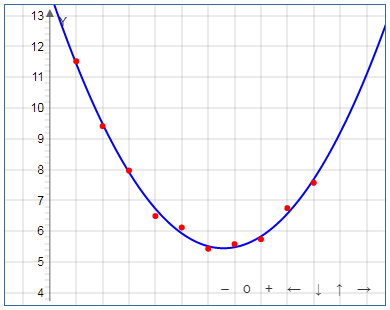
The graph and the value of the correlation coefficient show a good fit of the data to the quadratic regression model. So, the optimal speed can be found not only from the graph, but also analytically. Indeed, this speed corresponds to the minimum of the found quadratic function. You can find this minimum simply by differentiating this function with respect to \(x\) (speed) and equating this derivative to zero:
$$\frac{dy}{dx}=-0.253+0.004·x=0,$$
from which we get that the optimal speed is 63.25 km/h.
Related calculators
Check out our other statistics calculators such as Correlation Coefficient Calculator or Covariance Calculator.