The linear least squares regression line method is an accurate way to find the line of best fit in case it is assumed to be a straight line, which is the best approximation of a given data set. We consider a two-dimensional line y = ax + b where a and b are to be found. Enter the set of x and y coordinates of the input points in the appropriate fields of the Linear Regression Calculator and calculate the regression line parameters. You can paste the data copied from a spreadsheet or csv-file or input manually using comma, space or enter as separators.
Least Squares Regression Line
The Linear Least Squares Regression Line method is a mathematical procedure for finding the best fit of a straight line to a given set of points by minimizing the sum of the squares of the point offsets from the approximating line.
The minimum condition for the sum of squared offsets is the equality to zero of the derivatives of this sum with respect to the parameters of the approximating line. This leads to a system of two linear equations in two variables. Solving this system gives us the parameters \(a\) and \(b\):
$$a=\frac { n\sum _{ i=1 }^{ n }{ { x }_{ i } } { y }_{ i }-\sum _{ i=1 }^{ n }{ { x }_{ i }\sum _{ i=1 }^{ n }{ { y }_{ i } } } }{ n\sum _{ i=1 }^{ n }{ { x }_{ i }^{ 2 }-{ \left( \sum _{ i=1 }^{ n }{ { x }_{ i } } \right) }^{ 2 } } },$$
$$b=\frac { \sum _{ i=1 }^{ n }{ { y }_{ i } } -a\sum _{ i=1 }^{ n }{ { x }_{ i } } }{ n }.$$
Our least squares regression line calculator also calculates the correlation coefficient of the input data. The correlation coefficient measures the strength of linear relationship between two variables and thus gives the quality of a least squares fitting to the original data.
The correlation coefficient \(r\) (sometimes also denoted \(R\)) is defined by the formula:
$$r=a\frac { \sqrt { n\sum _{ i=1 }^{ n }{ { x }_{ i }^{ 2 } } -(\sum _{ i=1 }^{ n }{ { x }_{ i })^{ 2 } } } }{ \sqrt { n\sum _{ i=1 }^{ n }{ { y }_{ i }^{ 2 } } -(\sum _{ i=1 }^{ n }{ { y }_{ i })^{ 2 } } } } .$$
The correlation coefficient has the following characteristics.
1. The range of \(r\) is between -1 and 1, inclusive.
2. If \(r\) = 1, the data points fall on a straight line with positive slope.
3. If \(r\) = -1, the data points fall on a straight line with negative slope.
4. If \(r\) = 0, there is no linear relationship between the \(X\) and \(Y\) variables.
5. Correlation coefficient \(r\) is a measure of the linear association between the \(X\) and \(Y\) variables.
6. The value of \(r\) is unchanged if either \(X\) or \(Y\) is multiplied by a constant or if a constant is added.
Example of Linear Regression
Consider a real life example we took from the Online Stat Book. Let’s take a data set of high school and university GPA scores for a set of 105 computer science majors. We will start with the assumption that high school GPA will correlate with higher university GPA performance. Then, using linear regression, we can predict the GPA of students at university based on their performance in high school.
Plugging the data into our Linear Regression Calculator we can see that the scatter-plot created with the data shows a strong positive relationship between the two scores.
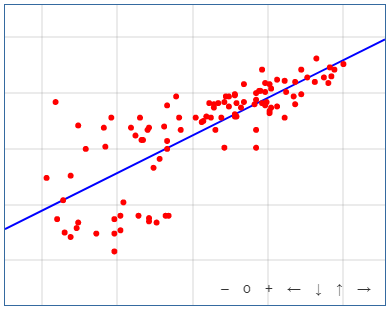
In particular, the value of the calculated correlation coefficient \(R = 0.78\) is a reliable indicator of such a correlation. The respective linear regression equation is:
$$University \ GPA = 0.675*(High \ School \ GPA) + 1.097.$$
This means that a student with a high school GPA of, say, 3 would be predicted to have a university GPA of 0.675 * 3 + 1.097 = 3.12.
Linear least squares regression calculator can be used in many practical problems to understand and describe the relationship between variables.
Related calculators
Check out our other statistics calculators such as Correlation Coefficient Calculator or Standard Deviation Calculator.